
Fig. 14.
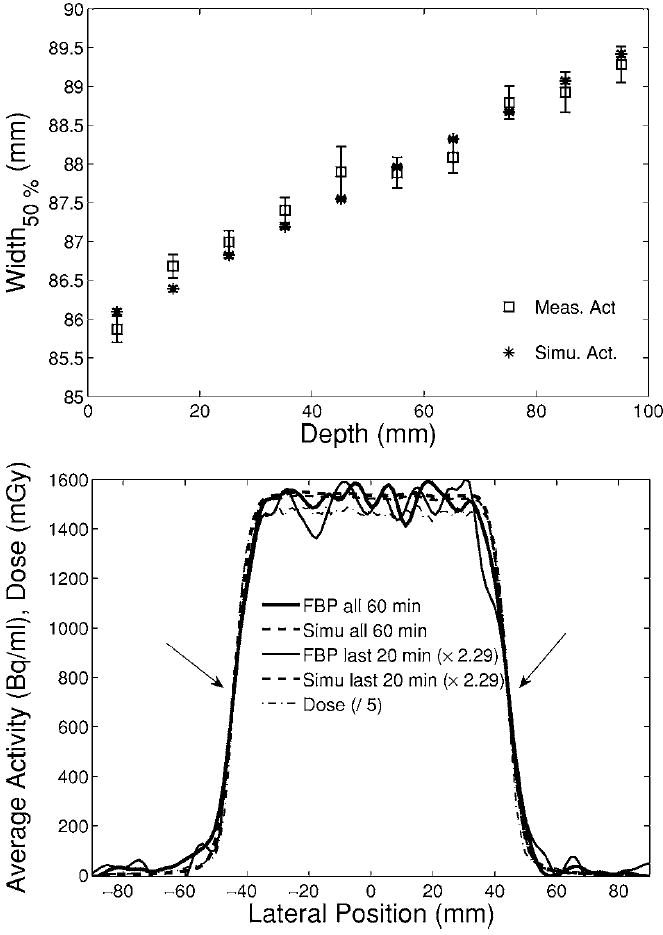
Top: Broadening in depth of the average width (squares: measurement, stars: simulation) of lateral profiles axially sampled in the interval [−15, 15] mm from the center of the distributions at each depth. Bottom: Example of measured (solid) and simulated (dashed) activity profile at the isocenter (65 mm depth) for the entire 60 min (thick) or only the last 20 min (thin, scaled by 2.29) acquistion. The arrows mark the 50% falloff position. The dash-dotted line shows the predicted dose profile (divided by 5).