
Fig. 2.
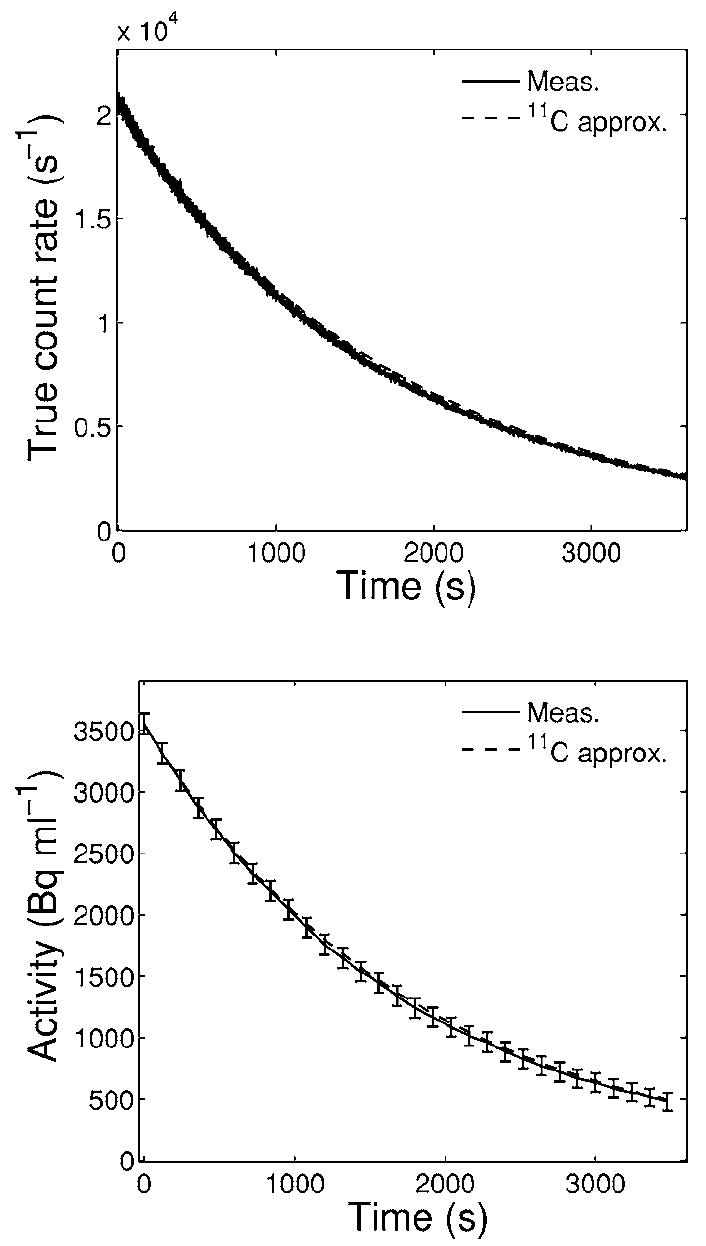
True count rate (top) as well as mean activity (bottom) reconstructed from 120 s long time frames and evaluated in a wide ROI (≈250 ml) within the irradiated volume for the 8 Gy single field irradiation of PMMA. Solid lines connect measured data. Dashed lines show the calculated exponential decay of the initial measured value when attributing the signal entirely to 11C. Error bars in the bottom panel are standard deviations of the shown mean values.