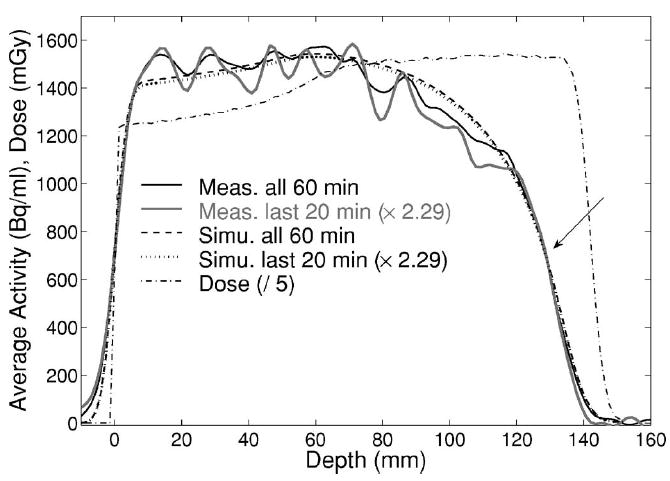
Fig. 7.

Measured (solid black, gray) and simulated (dashed, dotted) activity depth profiles for all 60 min or only last 20 min (scaled by 2.29) acquisition, respectively, after 8 Gy exposure of PMMA. The arrow indicates the 50% falloff position. The dash-dotted line shows the Monte Carlo calculated depth dose distribution, divided by a factor of 5 to allow for the same range scale of the activity (left axis).
