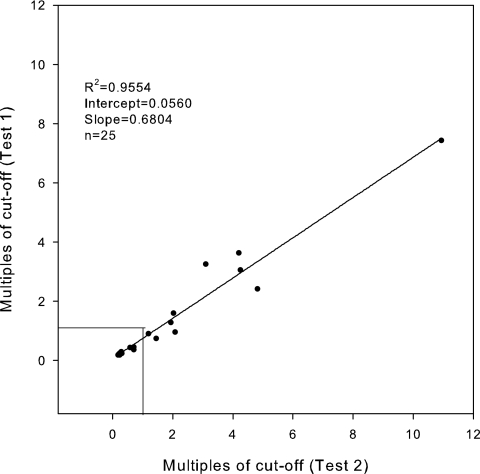
FIG. 2.
Reproducibility of antigen levels following ultrafiltration. Twenty-five specimens were concentrated and tested on consecutive days, and the results were compared by linear regression analysis. Data points below the 1.0 cutoff are clumped together for the negative controls, preventing identification of 15 different points. Data for the 10 positive specimens can be differentiated, showing that 7 of the 10 were reproducibly above the 1.0 cutoff.

