
Figure 2. Variability in crossmodally propagating waveforms.
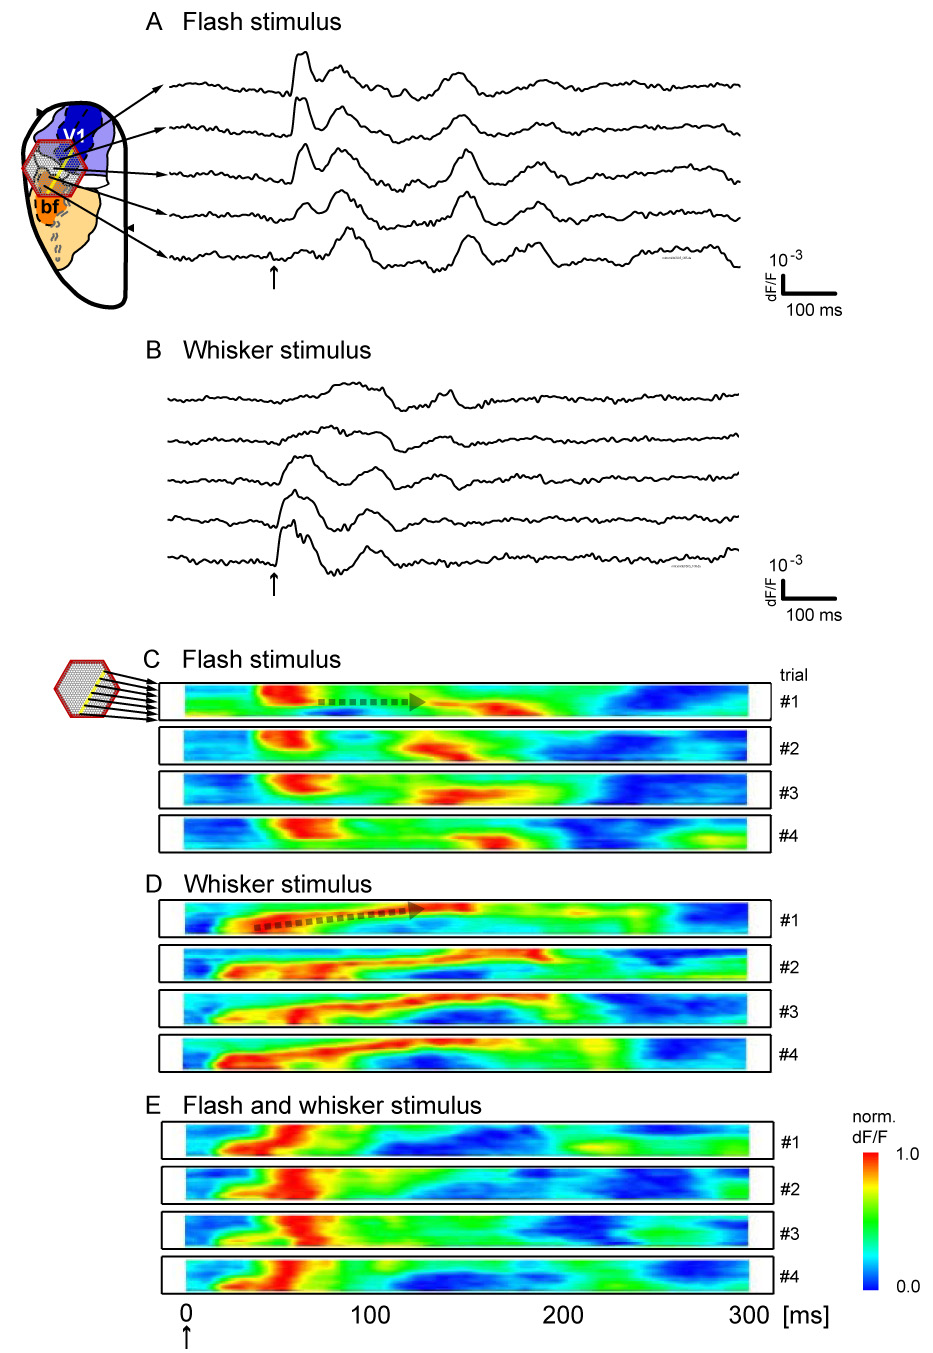
A,B. Single-trial waveforms from five single detectors along the crossmodal propagation path (yellow dots) are displayed for single trials with flash stimulus (A) and whisker stimulus (B). Waveforms change continuously and dynamically as they propagate across the cortex, and their amplitudes do not diminish suddenly at areal borders. C, D, E. Linescans of four representative trials each, with either flash stimulus (C), whisker stimulus (D), or both (E). In each linescan, signal from all detectors highlighted in yellow were aligned along the ordinate. Each row of each linescan depicts the temporal evolution of the normalized signal from a single detector. Flash-evoked activity (C) propagates from the upper detectors in V1 towards the lower detectors in S1bf; whisker-evoked activity (D) propagates in the reverse direction. Differences in onset and propagation pattern are seen in single trials. Simultaneous whisker and flash stimulation (E) leads to overall propagation from S1bf to V1; however, the spatiotemporal pattern is not a simple combination of those seen in C and D.