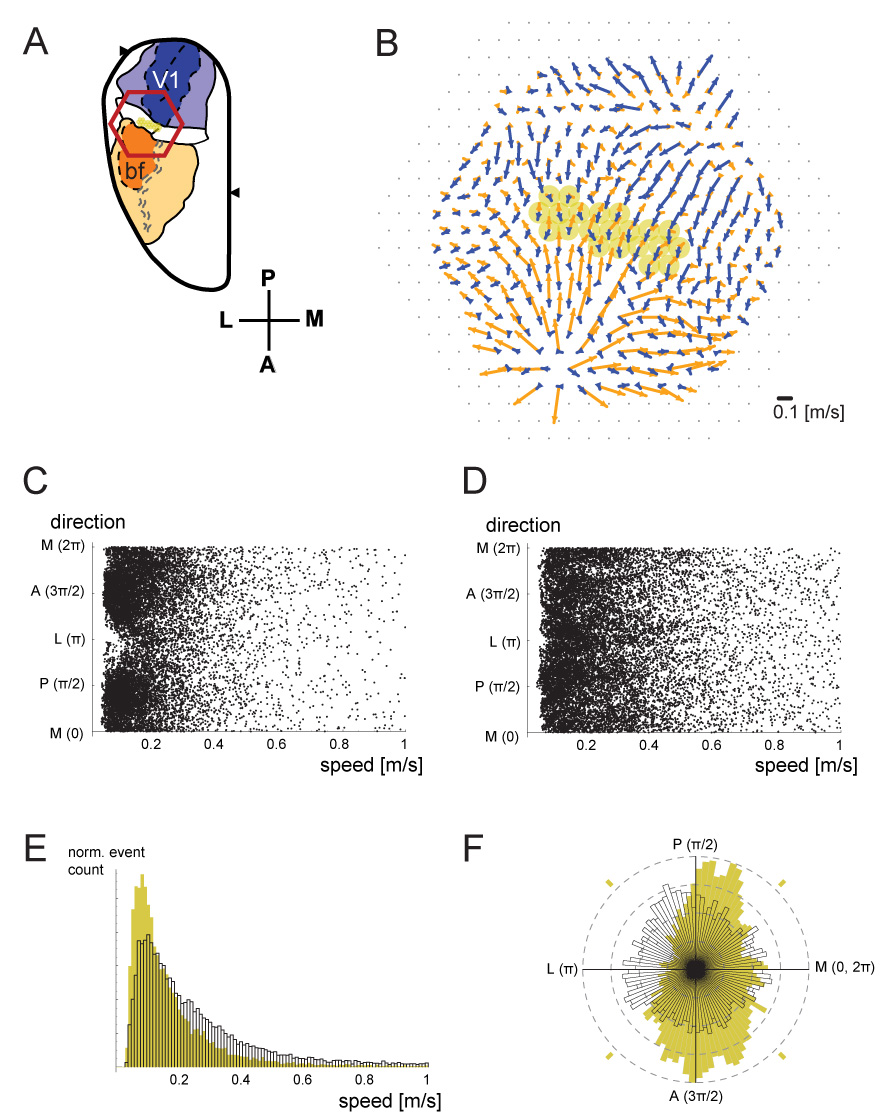
Figure 3. Crossmodal propagation preference of spontaneous waves.

A. Imaging field for this figure. Selected detectors within PA are highlighted in yellow. B. The average crossmodal flow field in response to flash (blue) or whisker deflection (orange) was quantified, using the flow-detection algorithm described in the text (n=60 trials for each condition). Selected detectors from A are highlighted here as well. C. The flow of spontaneous events was detected using the same algorithm, at the detectors highlighted in A and B. Each dot represents a single flow event. Only flows with a reliability (mean correlation coefficient) higher than 0.9 were plotted. D. Similar analysis of data acquired from the center of the barrel cortex, around barrel C2. E. Normalized histograms of the event speeds of data in C and D. The data from panel C, which is from area PA, was plotted in yellow. The data from panel D, from the center of S1bf, is plotted in white profile. F. Normalized rose histograms of the events are shown, in the same color scheme. Spontaneous events in PA (yellow) show a preference for the crossmodal direction, whereas those from the center of barrel cortex (white) do not.
