Figure 3.
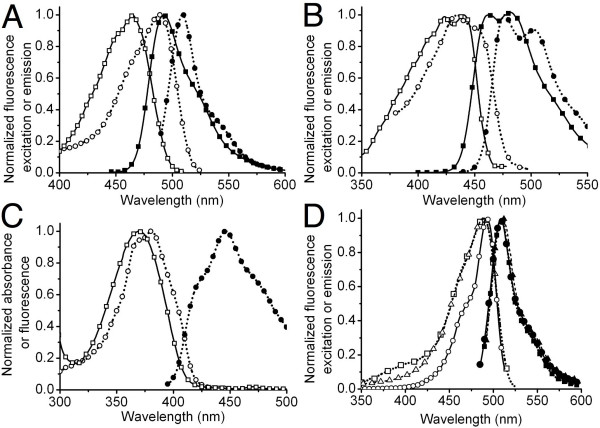
Spectra of hue-shifted variants of mTFP1. (A) Excitation (open symbols) and emission (filled symbols) spectra of EGFP (circle) and mTFP1 (square). (B) Excitation (open symbols) and emission (filled symbols) spectra of ECFP (circle) and mTFP1-Y67W (square). (C) Excitation (open symbols) and emission (filled symbols) spectra of EBFP (circle) and the absorbance (open symbols) spectrum of the nonfluorescent mTFP1-Y67H variant (square). (D) Excitation (open symbols) and emission (filled symbols) spectra of mWasabi (circle), EGFP (square) and Emerald (triangle). Spectra were collected at 1 nm steps, but only every fifth data point is shown for clarity.

