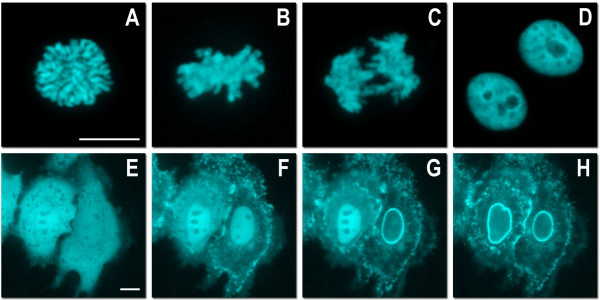
Figure 6.
Live cell imaging of mTFP1 fusion vectors. (A)-(D) Laser scanning confocal images of a single HeLa cell expressing mTFP1-H2B-6 (N-terminus; human) progressing through prophase, metaphase, anaphase and interphase, respectively. (E)-(H) Spinning disk confocal images selected from a time-lapse series of HeLa cells expressing mTFP1-annexin (A4)-12 (C-terminus; human) during ionomycin-induced translocation to the plasma and nuclear membranes [35]: (E) 0 min, ionomycin added; (F) 5 min; (G) 7 min; (H) 9 min. Scale bars represent 10 μm.

