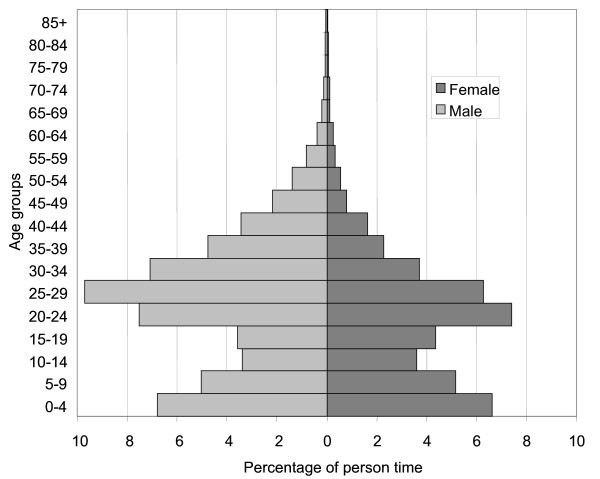
Figure 1.
Population pyramid for the study population, Nairobi DSS 2003–2005. Light grey bars indicate the population distribution for males and dark grey bars indicate the distribution for females. Calculations are based on the observed person time contributed to each age group over the study period.

