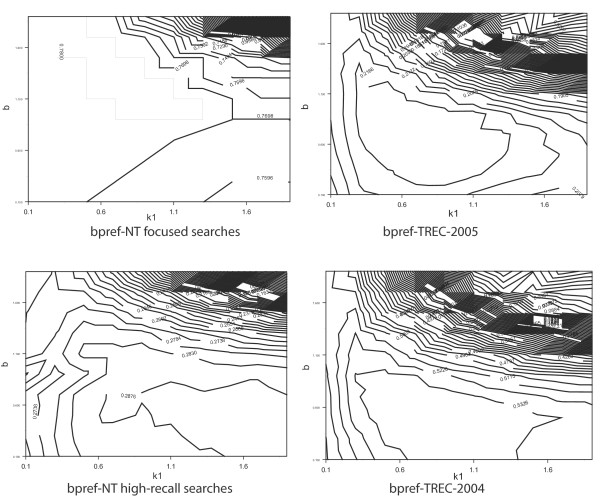
Figure 5.
NT Evaluation predicts favorable regions of the search parameter space. Each contour plot shows how retrieval performance changes with the value of parameters k1 and b of the Okapi BM25 search method. The top-left plot is constructed for focused searches. The two plots on the right are constructed with TREC Genomics Track relevance judgments. The plot on the bottom left is constructed with the high-recall NT Evaluation protocol. High-recall NT Evaluation and TREC Genomics evaluations show similar performance contours with respect to parameters, suggesting that NT Evaluation can be used to select reasonable search engine parameters without human relevance judgments.

