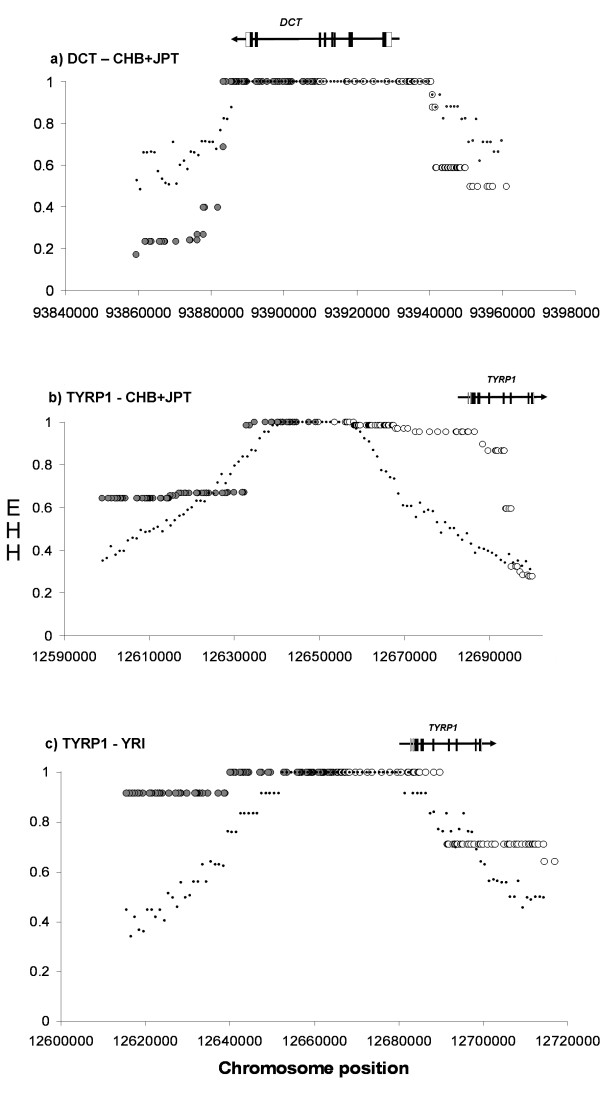
Figure 2.
Extended Haplotype Homozygosity (EHH) tests. After scanning the HapMap data with Sweep (see Methods) candidate core haplotypes were tested for the significance of their extended haplotype homozygosity (EHH). Circles represent the observed EHH values extending about 50 kb from the core haplotype in both directions, white for 3' and gray for 5'. Dots represent the corresponding 95% upper percentiles of the simulated EHH distributions. The approximate location of the lociwith respect to the core haplotypes is indicated on top: coding exons in black, UTRs in white, and the intervening lines represent the introns. The arrows indicate the direction of transcription. a) EHH for DCT in the HapMap Chinese+Japanese population; b) EHH for TYRP1 in the HapMap Chinese+Japanese population and c) EHH for TYRP1 in the HapMap Yoruba population.

