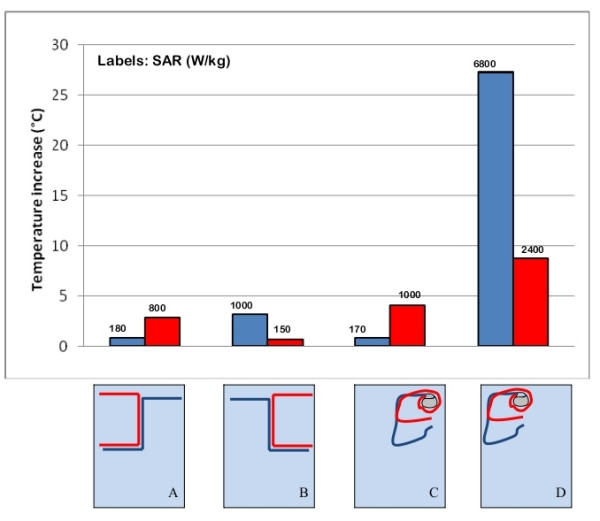
Figure 6.

Shaped and area enclosed by the implant. Comparison between the temperature increases and SAR measured at the tip of metallic wires of different shape (A, B); comparison between the temperature increases and SAR for PM implants of different area, in different regions of the phantom. The uncertainty in the reported SAR value is ± 2 dB. Each group of bars refers to the implant configuration reported below.
