Figure 3.

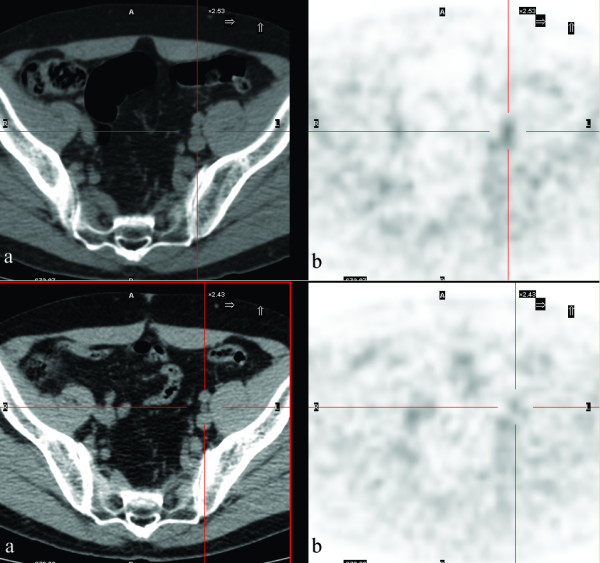
FDG-PET/CT transaxial views of the left iliac lymph node. (A) Low-dose CT; (B) PET. Upper images: pre-treatment (SUVmax 2.4); lower images: post-treatment (SUVmax 1.8).

FDG-PET/CT transaxial views of the left iliac lymph node. (A) Low-dose CT; (B) PET. Upper images: pre-treatment (SUVmax 2.4); lower images: post-treatment (SUVmax 1.8).