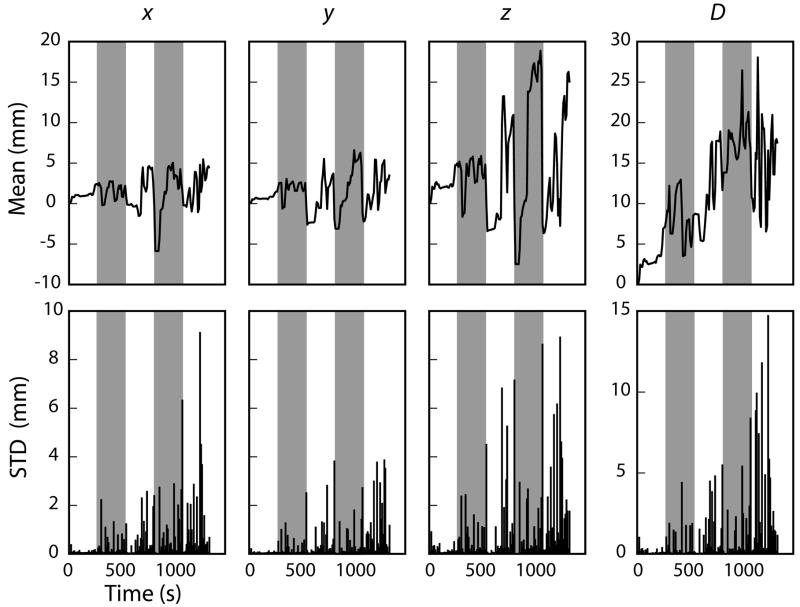
Figure 2.
The mean (top) and standard deviation (bottom) head movement in 10-second bins for one child over the course of the entire 25-minute experiment. The left three columns describe the relative head movement in the x (right-left), y (front-back), and z (up-down) directions, whereas the rightmost column indicates the mean displacement of the MEG sensors in the head-based coordinate system relative to the positions at the beginning of the experiment. The five runs are indicated with the alternating unshaded/shaded intervals.

