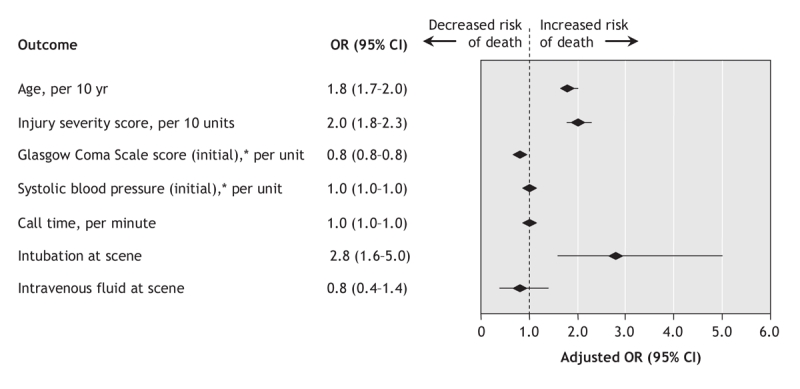
Figure 4: Adjusted odds ratios (ORs) and 95% confidence intervals (CIs) evaluating factors associated with mortality at hospital discharge. Model incorporates advanced life-support interventions as predictors of mortality. Goodness-of-fit: p > 0.20. *Initial assessments of Glasgow Coma Scale score and systolic blood pressure represent values from the scene; if missing, the value from the lead trauma hospital was used. †Time from call received to arrival of crew at patient side.
