Figure 2.
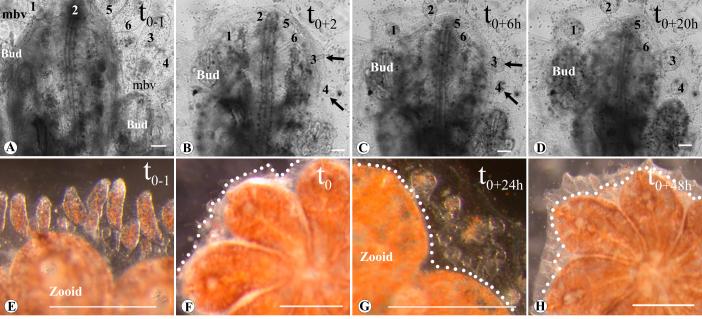
Time lapse images of vasculature regeneration in small (single zooid) (A-D) versus large (E-H) colonies. (A), Single zooid colony, 1 hour before ampullae and parts of the marginal vessel were removed (t0-1). (B), Same zooid 2 hours following vasculature removal (t0+2), the wound in the blood vessel at the surgical site is sealed and a small bulb (arrows) forms in the tip of the anastomized vessel (regeneration site1-6). (C) Same site, 6 hours later (t0+6); the bulbs became roundish (arrows), the marginal vessels that were removed (the vessel between regeneration sites 5 and 6, and the vessel above the right bud) have regenerated. (D) Same site, 20 hours later (t0+20); the regenerating ampullae became oval and recover their original size. (E), Ampullae and marginal blood vessel 1 hour before vasculature removal in a larger colony consisting of 8 zooids (t0-1). (F), Same colony after vasculature removal (t0), and (G) 24 hours later (t+24h). (H), 48 hours following vasculature removal (t+48h) full size regenerating ampullae can be seen above zooids and buds. Dots: edge of the cut, mbv: marginal blood vessel, 1-6: regenerating sites as compared to original ampullae number. Scale bar A-D=100μm, E-H=1mm

