Figure 1.
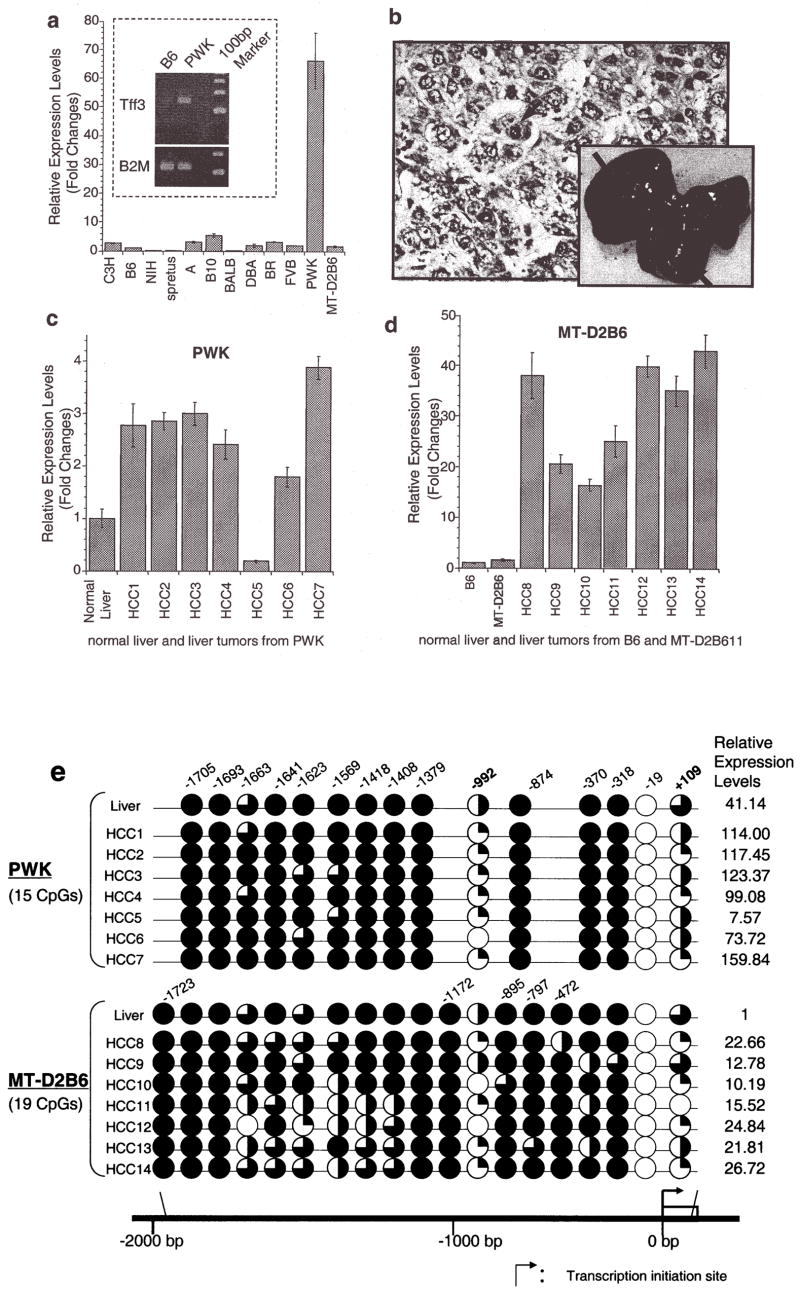
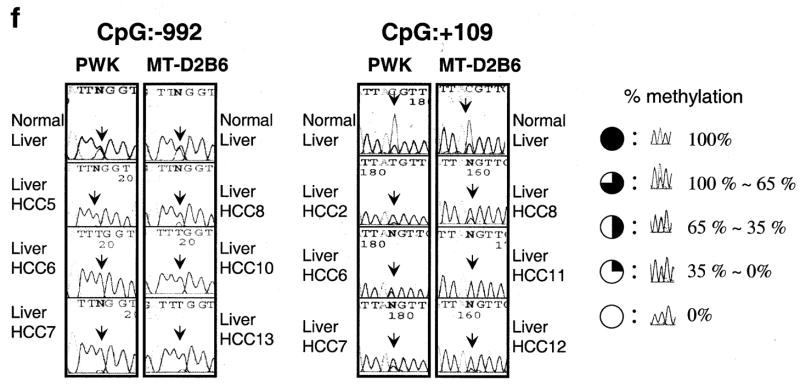
Relative expression levels of mouse TFF3 by quantitative real-time RT-PCR. (a), A bar graph of the mouse TFF3 expression levels with error bars (standard deviation) in liver among 12 mouse strains relative to B6 liver expression (B6=1) is drawn from real-time quantitative PCR. The highest expression was observed in PWK, which was 66-fold higher than that in the B6 liver. A semi-quantitative PCR result of an electrophoresis picture is also shown in the figure and confirmed the quantitative real-time PCR results of B6 and PWK livers (the top is for mouse TFF3 and the bottom is for a control of β-2 microglobulin). Each sample was loaded after 28 cycles. (b), Spontaneous liver tumors frequently developed in PWK, although no HCCs were observed in another susceptible strain of C3H during the same observation period. Pictures show a 56-week male PWK liver, where multiple spontaneous tumor nodules were observed (black arrows). An H&E staining of a spontaneous well-differentiated hepatocellular carcinoma (HCC) from PWK is shown. No normal hepatic lobular architecture was present. Instead, disorganized neoplastic hepatocytes with thickened cords were evident with marked nuclear pleomorphism and atypical mitosis (a black arrow). This tumor is indicated as HCC2 in Fig. 1c. (c), A bar graph shows the mouse TFF3 expression levels in spontaneous HCCs from PWK relative to normal liver expression and (d) HCCs from SV40 T antigen-induced transgenic MT-D2B6 relative to those in non-tumorigenic liver from MT-D2B6 at age 12 weeks. HCCs 1–7 indicate spontaneous HCCs from PWK and HCCs 8–14 indicate HCCs from MT-D2B6. A relative B6 liver expression is also shown. Six of seven tumors from PWK showed overexpression of mouse TFF3 and all tumors from MT-D2B6 showed overexpression of mouse TFF3 compared with non-tumor liver tissue from B6 and MT-D2B6. (e), Methylation status of mouse TFF3 5′-flanking regions. Approximately 2000 bp of genomic DNA in the promoter region were sequenced after bisulfite treatment. CpG identification numbers were referred to for positions from the transcription start site based on the B6 sequence. The pie chart indicates the CpG position [closed circle: 100% methylated CpG site, three-quarter circle: 99–65% methylated, half circle: moderate hypomethylation (65–35%), quarter circle: partial methylation (35–1%) and open circle indicates demethylation 0%]. Open box indicates the first exon. Red ovals indicate the differentially methylated regions in HCCs. Each expression level of TFF3 was calculated relative to normal B6 liver. (f), Bisulfite sequence results at CpGs −992 and +109 in HCCs. Black arrows indicate the cytosine of CpGs. The percentage of methylation is calculated by the C/T ratio of duplicated direct bisulfite sequencing. Both CpG position −992 and +109 are conserved between inbred B6 and PWK. HCCs from both strains were also hypomethylated at both CpG sites relative to non-tumor livers.


