
Figure 1.
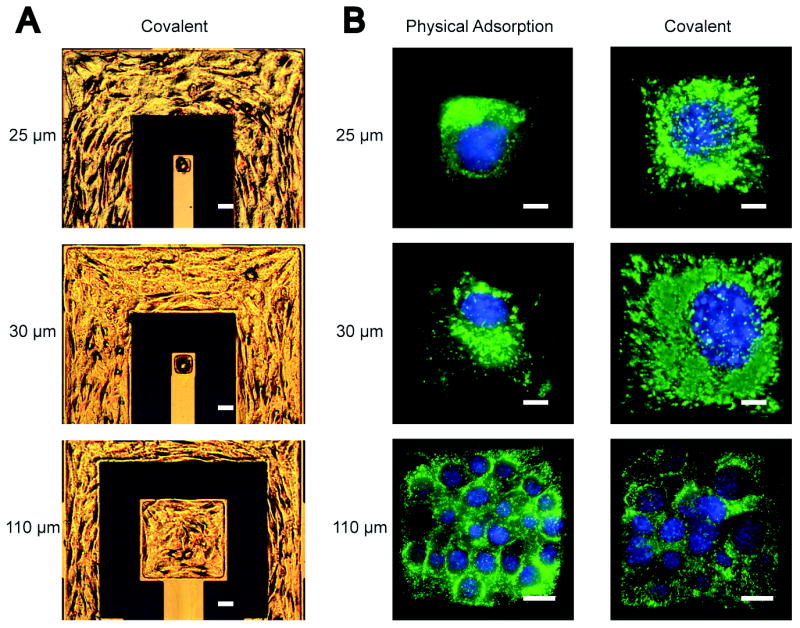
(A) Epi-DIC images of NIH3T3 single cells patterned on 25 μm and 30 μm detecting electrodes and multiple cells patterned on a 110 μm detecting electrode modified with covalently-bound KRGD. (B) Fluorescent images of nuclei- (blue) and membrane- (green) stained NIH3T3 cells on electrodes of three different sizes and modified with physically-absorbed (left, p-electrode) or covalently-bound (right, c-electrode) KRGD. The scale bar is 25 μm in (A), and 5 μm for 25-μm and 30-μm electrodes and 20 μm for 110-μm electrodes in (B).