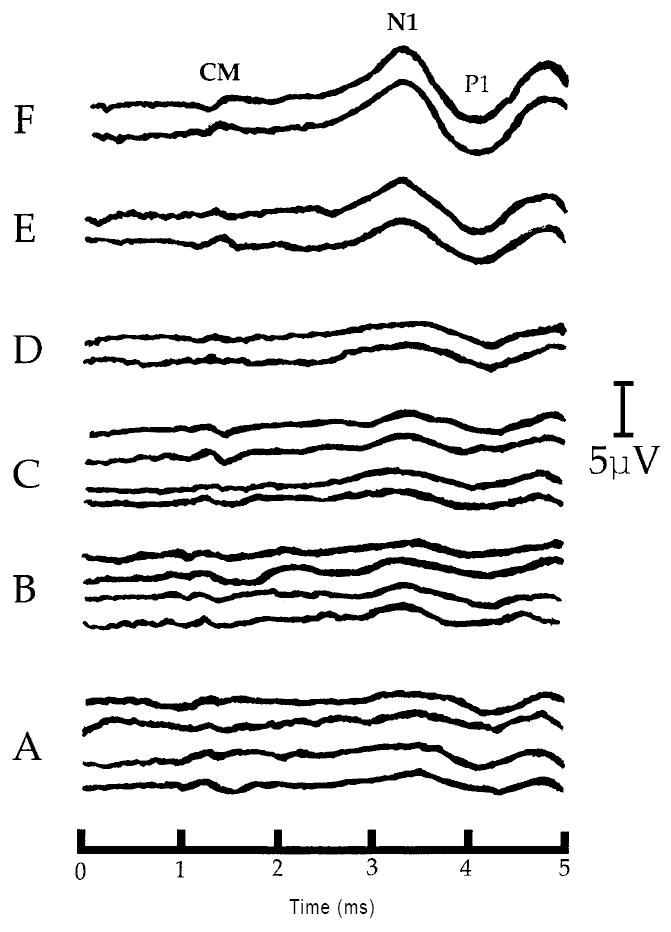
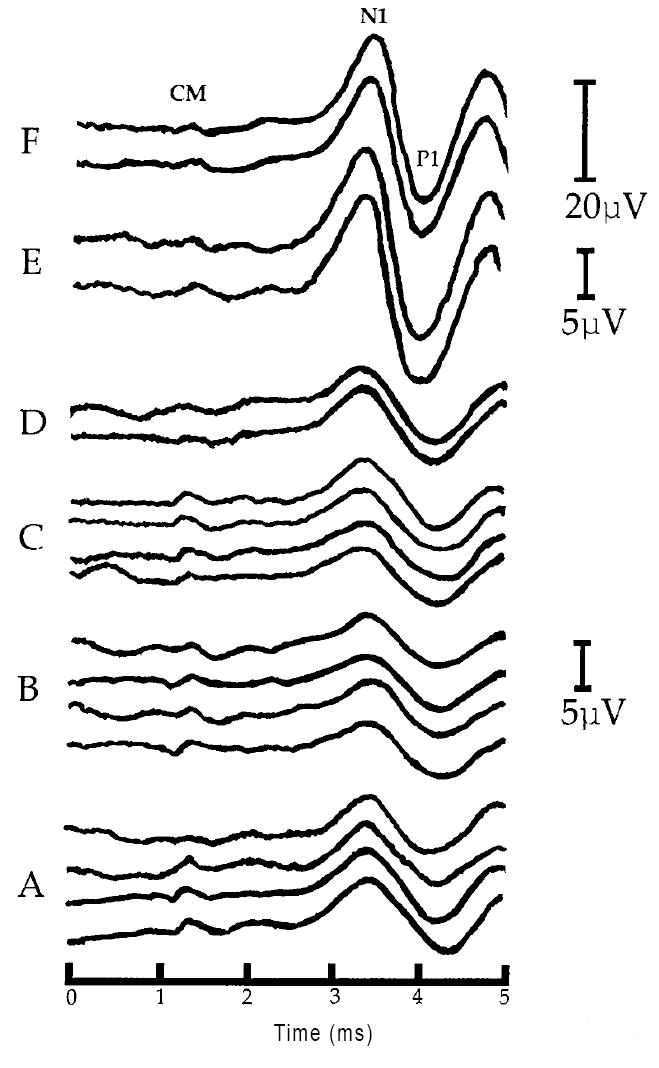
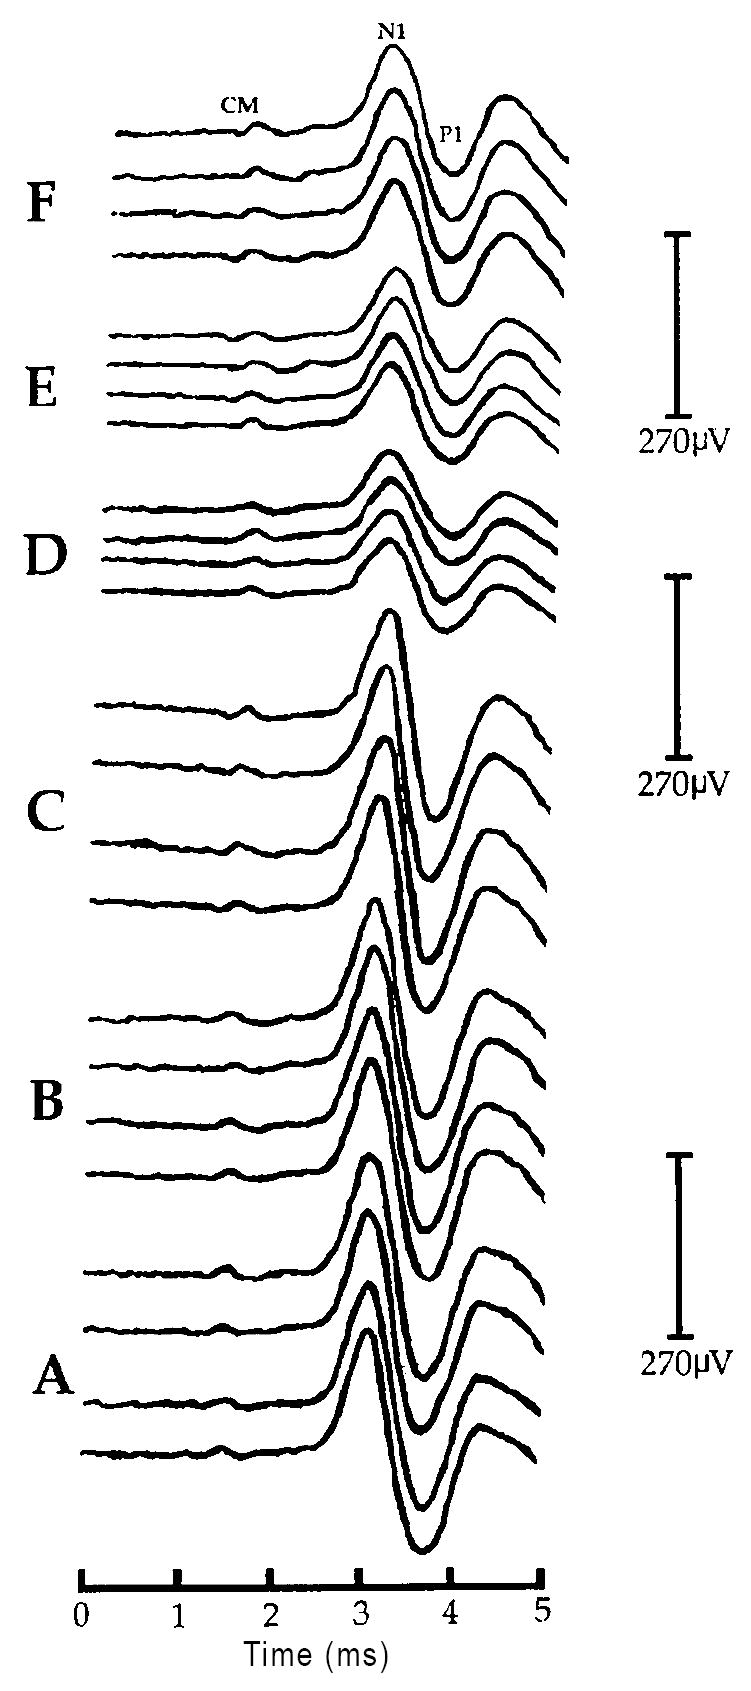
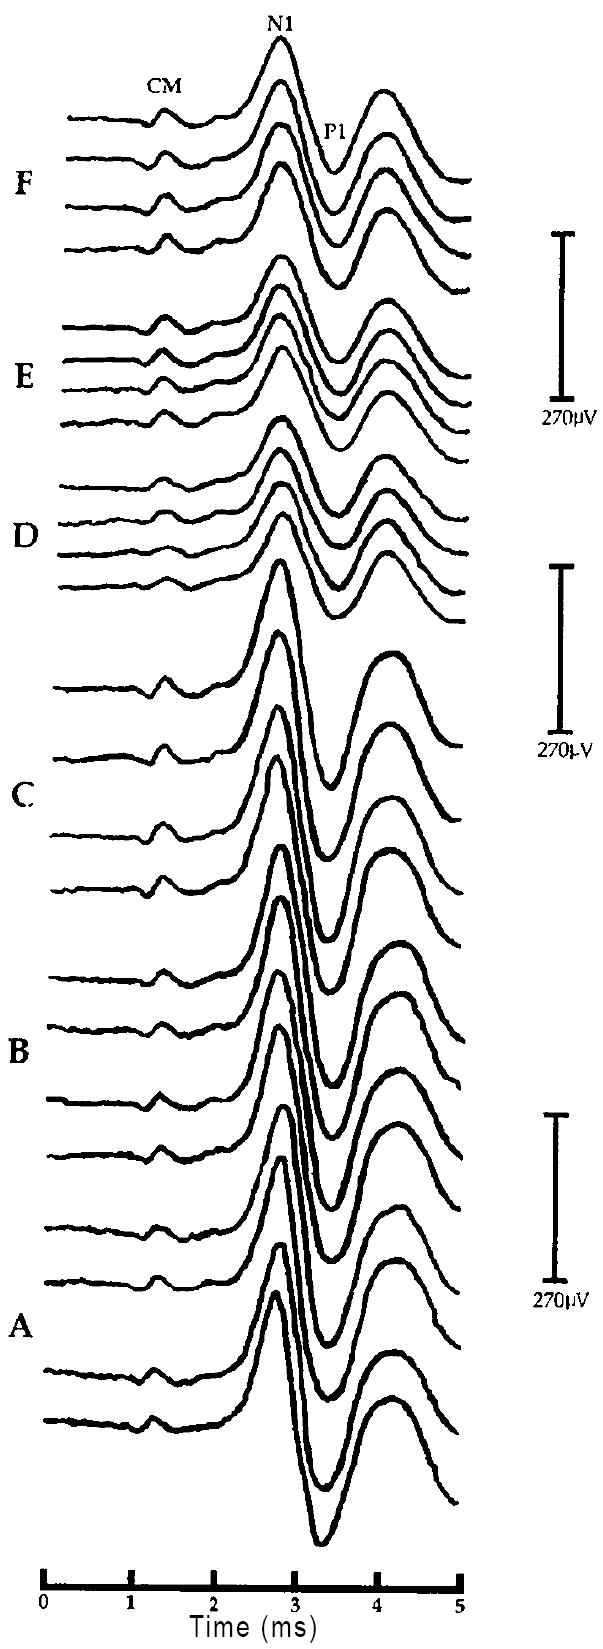
Fig. 4.


A: Positive post-baseline effect of U-50488H on the CAP - N1 amplitude at threshold in one representative chinchilla (#U5-01) from experiment 2. Each waveform was obtained at the same threshold intensity level (22dB SPL). Shown are sets of waveforms obtained during each of the six, 30 min recording periods labeled A-F. Four responses are shown at each of the three baseline recording intervals (A-C) corresponding to time 30, 60 and 90 min, respectively. Two responses are shown at each of the three post-baseline recording intervals (D-F) corresponding to time 120, 150 and 180 min, respectively. Positive post-baseline amplitude changes at threshold are clearly visible during the post-baseline periods E and F (time 150 and 180 min, respectively). All waveforms are displayed with negative-polarity up. Labeled are the cochlear microphonic (CM), and the first negative peak (N1) and first positive trough (P1) of the auditory whole nerve compound action potential. All latencies are uncorrected for the 0.9 ms acoustic delay produced by the 28cm in length sound tube assembly of the ER-3A microphone (e.g. Beauchaine et al., 1987). Note: lack of a corresponding change in the CM amplitude and CAP - N1 latency following U-50488H.
B: Positive post-baseline effect of U-50488H on the CAP - N1 amplitude at 5dB above threshold (SL) in one representative chinchilla (#U5-01) from experiment 2. Shown are sets of waveforms obtained during each of the six, 30 min recording periods labeled A-F. Four responses are shown at each of the three baseline recording intervals (A-C) corresponding to time 30, 60 and 90 min, respectively. Two responses are shown at each of the three post-baseline recording intervals (D-F) corresponding to time 120, 150 and 180 min, respectively. Positive post-baseline amplitude changes at 5dB SL are clearly visible during the post-baseline periods E and F (time 150 and 180 min, respectively). All waveforms are displayed with negative-polarity up. Labeled are the cochlear microphonic (CM), the first negative peak (N1) and the first positive trough (P1) of the auditory whole nerve compound action potential. All latencies are uncorrected for the 0.9 ms acoustic delay produced by the 28cm in length sound tube assembly of the ER-3A microphone (e.g. Beauchaine et al., 1987). Note: lack of a corresponding change in the CM amplitude and CAP - N1 latency following U-50488H, as well as the corresponding scale adjustments (μV) as amplitude continues to increase from the post-baseline recording periods E to F (time 150 to 180 min, respectively).
C: Negative post-baseline effect of U-50488H on the CAP - N1 amplitude at 30dB above threshold (SL) in one representative chinchilla (#U5-01) from experiment 2. Shown are sets of waveforms obtained during each of the six, 30 min recording periods labeled A-F. Four responses are shown at each of the three baseline recording intervals (A-C) corresponding to time 30, 60 and 90 min, respectively. Two responses are shown at each of the three post-baseline recording intervals (D-F) corresponding to time 120, 150 and 180 min, respectively. Negative post-baseline amplitude changes at 30dB SL are clearly visible during post-baseline periods D-F (time 120, 150 and 180 min, respectively). All waveforms are displayed with negative-polarity up. Labeled are the hair cell-generated cochlear microphonic (CM), the first negative peak (N1) and the first positive trough (P1) of the auditory whole nerve action potential. All latencies are uncorrected for the 0.9 ms acoustic delay produced by the 28cm in length sound tube assembly of the ER-3A microphone (e.g. Beauchaine et al., 1987). Note: lack of a corresponding change in the CM amplitude and CAP - N1 latency following U-50488H.
D: Negative post-baseline effect of U-50488H on the CAP - N1 amplitude at 40dB above threshold (SL) in one representative chinchilla (#U5-01) from experiment 2. Shown are sets of waveforms obtained during each of the six, 30 min recording periods labeled A-F. Four responses are shown at each of the three baseline recording intervals (A-C) corresponding to time 30, 60 and 90 min, respectively. Two responses are shown at each of the three post-baseline recording intervals (D-F) corresponding to time 120, 150 and 180 min, respectively. Negative post-baseline amplitude changes at 40dB SL are clearly visible during post-baseline periods D-F (time 120, 150 and 180 min, respectively). All waveforms are displayed with negative-polarity up. Labeled are the hair cell-generated cochlear microphonic (CM), the first negative peak (N1) and the first positive trough (P1) of the auditory whole nerve compound action potential. All latencies are uncorrected for the 0.9 ms acoustic delay produced by the 28cm in length sound tube assembly of the ER-3A microphone (e.g. Beauchaine et al., 1987). Note: lack of a corresponding change in the CM amplitude and CAP - N1 latency following U-50488H.
