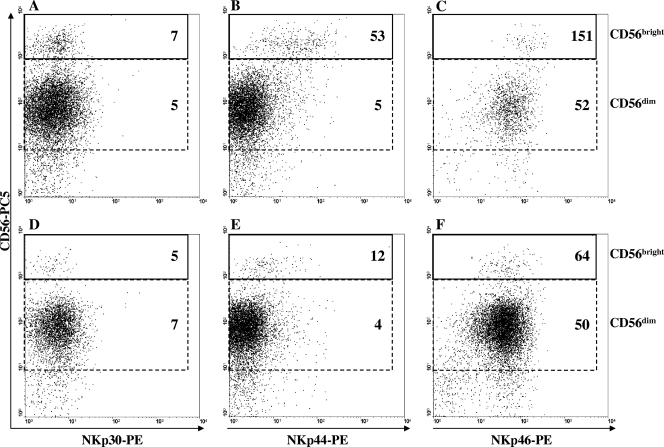
FIG. 2.
Surface density expression of NKp30 (A, D) NKp44 (B, E), and NKp46 (C, F) on CD56bright and CD56dim cells after 4 days of in vitro stimulation with live BCG (A, B, C) or on cells left unstimulated (D, E, F). Plots from a representative experiment are illustrated. Numbers indicate the MFI levels of three NCRs on CD56bright and CD56dim NK cell subsets. Percentages of total CD56bright NK cells were as follows: for unstimulated NK cells, 2.4%, and for BCG-stimulated NK cells, 6.4%.

