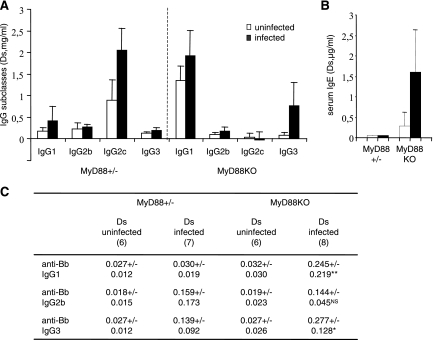
FIG. 2.
IgG and IgE responses in B. burgdorferi-infected MyD88 KO and MyD88+/− mice compared to those in noninfected controls (A) Mean levels ± SD of total serum IgG1, IgG2b, IgG2c, and IgG3 in infected mice (black bars) and noninfected mice (white bars). Numbers of mice are indicated in panel C. Sera were collected from mice 4 weeks after infection. Ds, day of sacrifice. IgG isotypes were evaluated by ELISA. (B) Levels of IgE in infected and noninfected mice. Four mice were tested in each group. (C) Effect of MyD88 deficiency on B. burgdorferi-specific IgG isotype distribution (anti-B. burgdorferi Ig). Values represent the mean optical densities ± SD observed for a 1/200 serum dilution. Numbers of mice are indicated in each column. Statistical differences between the concentrations at the day of sacrifice (Ds) for infected MyD88 KO and MyD88+/− mice are designated by asterisks (**, P = 0.001; *, P = 0.03 [Wilcoxon test]). NS, no statistical difference.

