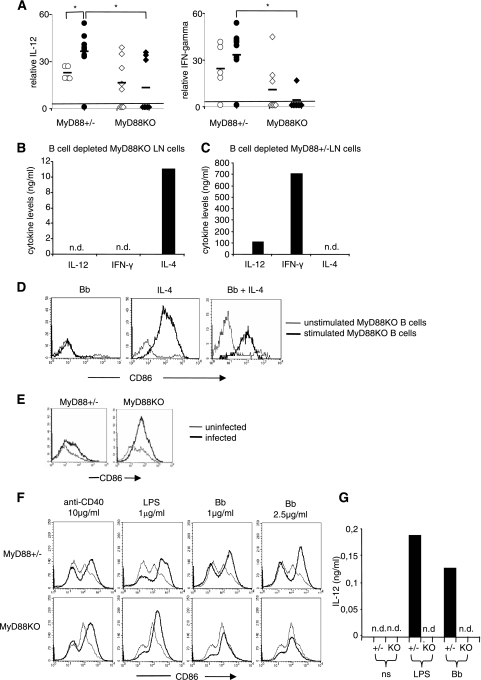
FIG. 7.
Th1-Th2 cytokine imbalance and DCs could drive B-cell activation and IgM production in vivo in infected MyD88 KO mice. (A) Serum IL-12 and IFN-γ were measured by ELISA in infected (black symbols) and uninfected (white symbols) MyD88 KO and MyD88+/− mice and compared to the detectability threshold of the ELISA method used (black lines; 15.6 pg/ml and 16 pg/ml, respectively). Numbers of mice were as follows: for uninfected MyD88+/− mice, n = 5; for infected MyD88+/− mice, n = 10; for uninfected MyD88 KO mice, n = 8; and for infected MyD88 KO mice, n = 8. (B and C) B-cell-depleted MyD88 KO (B) or MyD88+/− (C) in vivo-activated LN cells (anti-CD19 negative sorting) were cultured in the presence of sonicated B. burgdorferi (10 μg/ml). Supernatants were tested for IL-12, IFN-γ, and IL-4 levels by ELISA. n.d., nondetectable. (D) Purified LN MyD88 KO B cells were cultured for 60 h with sonicated B. burgdorferi (10 μg/ml), IL-4 (0.1 ng/ml), or both. Diagrams show expression of CD86 in stimulated (thick lines) and control unstimulated (thin lines) cells. (E) Expression of CD86 on DCs in MyD88 KO and MyD88+/− infected mice. Histograms show CD86 staining on CD11c-positive cells from infected (thick lines) and uninfected (thin lines) mice. (F) Bone marrow-derived DCs from MyD88+/− and MyD88 KO mice were cultured for 60 h with anti-CD40 antibody (10 μg/ml), LPS (1 μg/ml), or B. burgdorferi (1 or 2.5 μg/ml). Diagrams show expression of CD86 on stimulated (thick lines) and unstimulated (thin lines) CD11c+ cells. (G) After stimulation as depicted in panel F, the IL-12 concentration in the supernatants was evaluated by ELISA. n.d., nondetectable.

