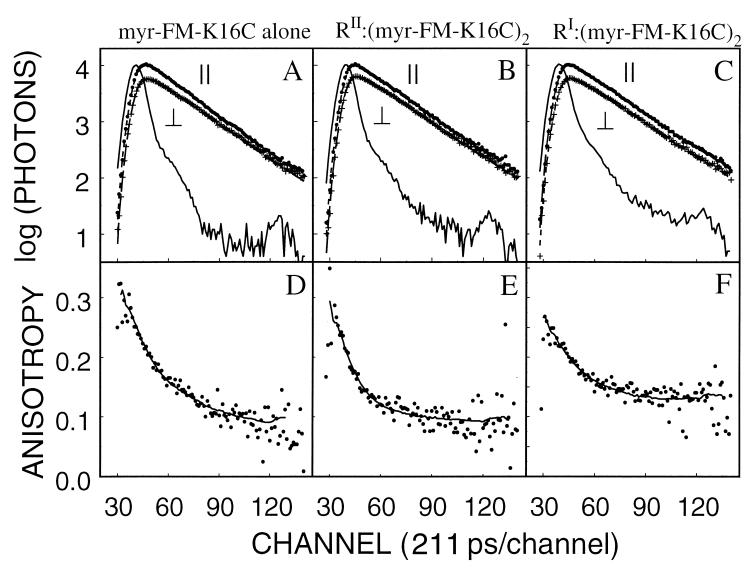
Figure 3.
Emission and anisotropy decays of myr-FM-K16C alone and bound to the RI and RII subunits. A–C illustrate the parallel (∥) and perpendicular (⊥) emission decays (single datum points), a smooth line through these points generated with the best fit parameters for a single exponential decay equation, and a flash lamp profile (wavy solid line). D–F illustrate the time-resolved anisotropy decay (single datum points) and a smooth line through these points generated with the best fit parameters (Table 2) for a double exponential decay equation (Eq. 2). (A, D) Myristylated FM-K16C alone. (B, E) Myristylated type II holoenzyme [RII:(FM-K16C)2]. (C, F) Myristylated type I holoenzyme [RI:(FM-K16C)2].

