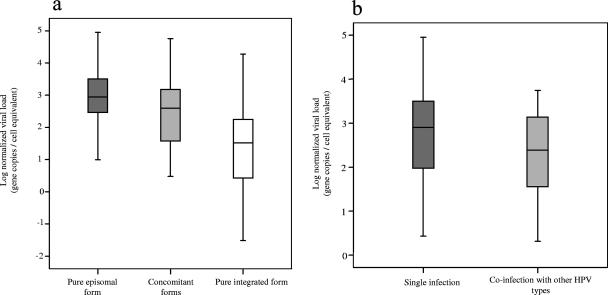
FIG. 3.
Distribution of viral load according to infection characteristics. (a) Physical status of viral genome. (b) Infection status. The middle line indicates the median. The box represents the interquartile range. The lines extending from each box represent the upper and lower limit. The normalized viral load was calculated by the equation (E7copy/beta-actincopy) × 2.

