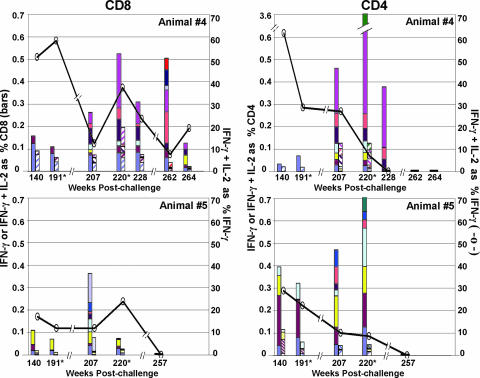
FIG. 2.
Temporal heights of IFN-γ and IFN-γ plus IL-2 responses to Gag and Env epitopes. The filled bars represent the IFN-γ responses, and the hatched bars represent the IFN-γ plus IL-2 responses to individual epitopes plotted as percentages of total CD8 or CD4 T cells. The solid lines represent the average percentages of IFN-γ-producing cells that coproduced IL-2. CD8 (left) and CD4 (right) responses were mapped at 140, 207, 228, 262, and 264 weeks postchallenge for animal 4 (top) and at weeks 140, 207, and 257 postchallenge for animal 5 (bottom). At weeks 191 and 220 (*), the animals were retested by intracellular-cytokine staining for previously mapped epitopes (14). Epitope-containing sequences, designated as in the study by Sadagopal et al. (14), are shown in different colors. Animal 4 CD8: periwinkle, Gag 10/11; plum, Gag 107/108; yellow, Gag 2; light turquoise, Gag 25/26; dark purple, Gag 35/36; coral, Gag 47; ocean blue, Env 138; ice blue, Env 18; dark blue, Env 32; red, Env 43. Animal 4 CD4: periwinkle, Env 43; plum, Env 161; yellow, Gag 52; light turquoise, Gag 20; dark purple, Gag 97; coral, Gag 46; pink, Gag 25/26; sea green, Gag 47/48. Animal 5 CD8: periwinkle, Gag 35/36; plum, Env 63; yellow, Env 138; light turquoise, Gag 39/40; dark purple, Gag 59; coral, Gag 64; ocean blue, Gag 101; ice blue, Env 73. Animal 5 CD4: periwinkle, Gag 21; plum, Gag 39/40; yellow, Gag 62; light turquoise, Env 10/11; dark purple, Env 2; coral, Gag 66; ocean blue, Gag 15; sea green, Gag 101.

