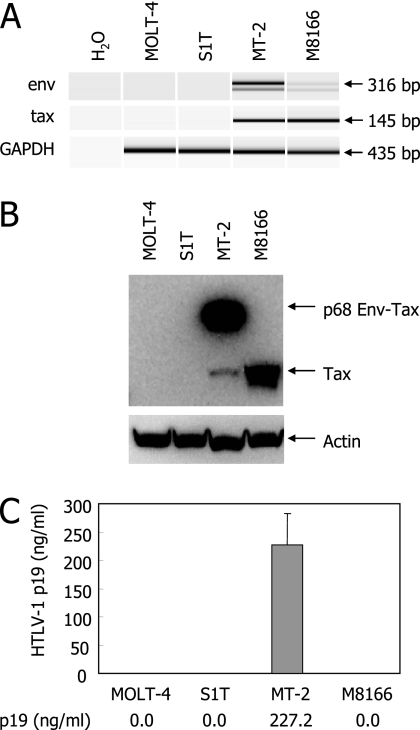
FIG. 1.
Different patterns of viral gene expression in HTLV-1-carrying T-cell lines. (A) Detection of HTLV-1 env and tax gene expression in MOLT-4 (negative control), S1T, MT-2, and M1866 cells. Total RNA was extracted from the cells and subjected to RT-PCR with primer pairs described in Materials and Methods. GAPDH mRNA was also amplified as an internal control. The amplified products were analyzed by an Agilent Bioanalyzer. (B) Western blot analysis of the cells for detection of HTLV-1 Tax. The cell lysates were electrophoresed and transferred to a membrane, as described in Materials and Methods. The transferred proteins were reacted with an anti-p40 Tax MAb or an anti-actin polyclonal antibody, followed by treatment with the second antibody. Antibody binding was visualized with an enhanced chemiluminescence detection system. (C) The production of viral particles and antigens from the cells. The cells were incubated for 3 days. After incubation, culture supernatants were collected and examined for their p19 antigen levels by ELISA. The error bar indicates standard deviation.

