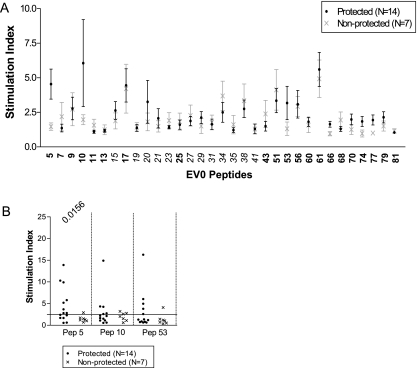
FIG. 3.
Peptide-specific proliferation responses in protected and nonprotected ponies. (A) SI for each peptide from the thymidine incorporation assay were averaged for the 14 protected ponies and the 7 nonprotected ponies to highlight differences in peptide responses. Variant peptides are shown in italics, and conserved peptides are shown in bold. (B) Specific reactivity for each pony to the peptides of interest in the thymidine incorporation assay. The P value from Student's t test is listed for each statistically significant peptide.

