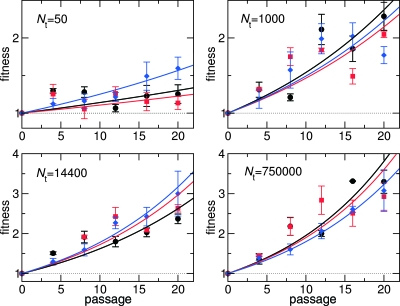
FIG. 1.
Changes in relative fitness as a function of passage number for four representative Nt. Solid lines represent the least-square fit of the expression Vt (where t is the passage number) to the log-transformed fitness data. Larger populations experienced a more rapid fitness increase and less variation in fitness. Three different colors correspond to three replicate experiments. Vertical bars represent the standard deviations of the mean (standard errors) of fitness for each replica determined in the competition assays.

