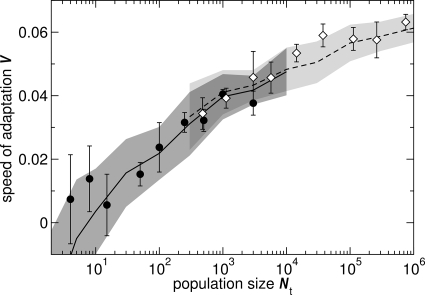
FIG. 2.
Initial speed of adaptation, V, as a function of the transmission size, Nt. Symbols represent the measured adaptation speeds, which were averaged over the first 20 passages (Fig. 1), and vertical bars represent the associated standard deviations of the means. Black circles were obtained by plaque pooling, and open diamonds were obtained under dilution regimen conditions. Note the close match between the three values obtained by both methods. The solid line is the average adaptation speed predicted by the fitted simulation model for plaque-based passages, and the dashed line is the same value for dilution passages. The gray areas indicate 1 standard deviation around the predicted average adaptation speed. The average adaptation speed and standard deviation were calculated from 100 independent simulation runs. Fixed parameters are μP, 1.5 × 10⁻⁴ (for plaque pooling); μD, 1.0 × 10⁻⁴ (for dilutions). Fitting parameters are s, 0.39, kref = 6.25; L = 1,000; and d = 0.67.

