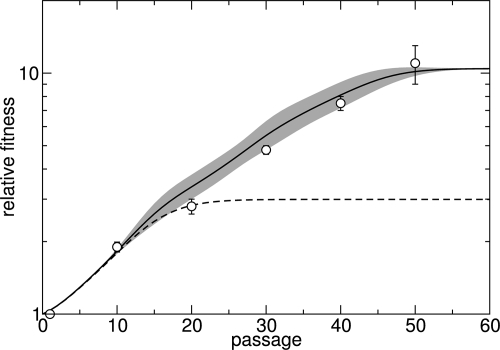
FIG. 3.
Approach of virus fitness to mutation-selection balance for MARM U at a large Nt passaged under dilution regimens. Symbols represent MARM U fitness (22), and vertical bars represent the associated standard deviation of the mean. The solid line is a fit of the average fitness from the simulation model to the data at an Nt of 2 × 10⁵. Other parameters are shown in the legend of Fig. 2. The gray area indicates 1 standard deviation around the average fitness. Average fitness and standard deviation were calculated from 100 independent simulation runs. The dashed line shows the model behavior if beneficial mutations are turned off. Thus, the initial 20 passages were dominated by the amplification of preexisting variants, whereas the later fitness increase was caused by the generation of new, beneficial mutations.

