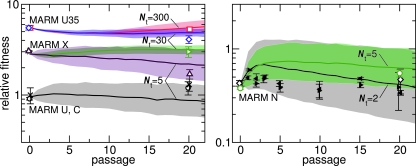
FIG. 4.
Change in simulated fitness values close to the critical bottleneck size of Nt for several VSV strains passaged under plaque-pooling conditions. Open symbols represent measured fitness, averaged over six independent replicas, with error bars showing standard deviations of the means. Closed symbols in the right panel show fitness values at intermediate time points for two replicas at an Nt of 2. Data are both new and obtained from reference 24. For all symbols, we added a small amount of noise to the passage number to reduce symbol overlap. Solid lines and shaded areas indicate simulation results as described in the legends to Fig. 2 and 3. The observed fitness was approximately the same at passages 0 and 20 at the critical bottleneck size (24 and the present report). We also show simulation results for a subcritical transmission size for strains MARM X and MARM U35 and for a supercritical transmission size for strain MARM N. The transmission sizes for the different strains are indicated in the figure. The deleterious-allele-number variance d value is 0.67 for MARM U and MARM C, 0.29 for MARM X and MARM U35, and 1.7 for MARM N. Other parameter values are the same as those shown in Fig. 2 and 3.

