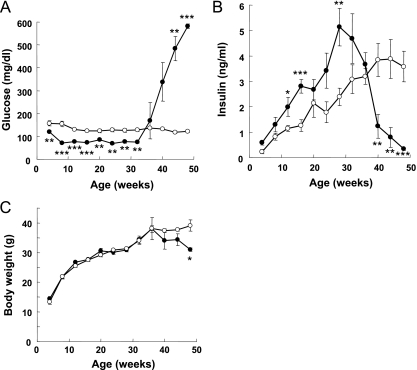
FIG. 2.
Effect of β-cell TSC2 ablation on glucose metabolism. Blood glucose concentration (A), plasma insulin concentration (B), and body weight (C) are shown for control (open circles; n = 10) and βTSC2−/− (filled circles; n = 12) mice at the indicated ages as measured in the randomly fed state. Data are means ± SEM. *, P < 0.05; **, P < 0.01; ***, P < 0.001 for comparison with the corresponding values for control mice.

