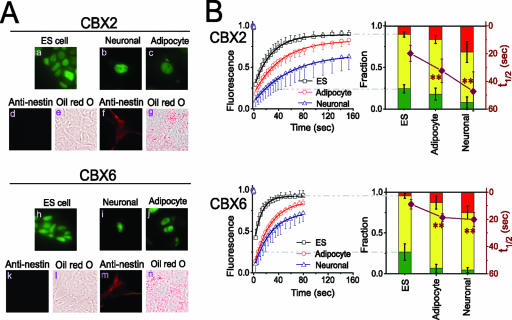
FIG. 3.
CBX fusion distributions and mobilities in ES cells induced to differentiate into different cell types. (A) Distributions of CBX fusions in ES cells induced to differentiate into neuronal and adipocyte precursors. Epifluorescence images of the CBX2#16 and CBX6#8 cell lines were acquired before differentiation (a and h), 13 days after the induction of neuronal differentiation (b and i), and 23 days after the induction of adipocyte differentiation (c and j). The cells were also stained by using nestin antibody (ES cells [d and k] and neuronal progenitors [f and m]) or Oil Red O (ES cells [e and l] and adipocyte progenitors [g and n]). The fluorescence of the CBX fusion proteins is shown in green, and the signals corresponding to nestin and Oil Red O are shown in red. (B) The fluorescence recovery in cells comparable to those shown in panel A was quantified and plotted as described for Fig. 1. The curves on the left show the fluorescence recovery in undifferentiated ES cells (black) and in adipocyte (red) as well as neuronal (blue) precursors. The data shown represent mean values and standard deviations (error bars). The images are representative of the majority of cells in each population (see Table S1 in the supplemental material). **, statistically significant difference between the rates of fluorescence recovery in differentiating ES cells and undifferentiated cells (P < 0.01 by Student's t test).

