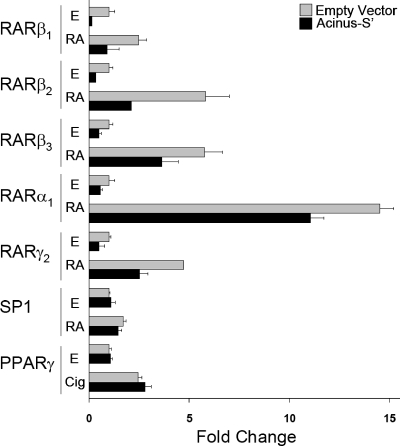
FIG. 1.
Effect of Acinus-S′ on reporter gene activity. The bar graph indicates relative reporter gene activity levels from transfected CV-1 cells treated with ethanol (E), 1 μM RA, or 1 μM ciglitazone (Cig) for 24 h. The change in normalized CAT or Luc activity was calculated relative to cells that were transfected with empty vector DNA (no Acinus-S′) and treated with ethanol (set as 1). Error bars indicate standard deviations.

