FIG. 3.
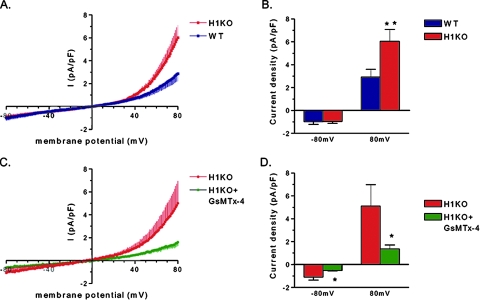
Membrane current of Homer 1 knockout (H1KO) versus WT day 5 myotubes. (A) Current density-voltage (I-V) relationships of whole-cell current of Homer 1 KO (H1KO; red) versus WT (blue) myotubes. Currents were induced by 200-ms voltage ramp protocols (1 mV/ms, from 100 mV to −100 mV) with a holding potential of −60 mV. Currents were normalized to membrane capacitance and shown in averaged traces. Vertical bars represent the standard error of the mean. (B) Group mean current amplitudes of WT (blue; n = 9) versus H1KO (red; n = 11) at −80 mV (downward) and +80 mV (upward) (**, P < 0.01). (C) Effect of tarantula toxin (5 μM GsMTx-4) on membrane current of KO myotubes. GsMTx-4 (green) inhibited membrane current at both positive and negative membrane potentials. (D) Group mean values of Homer 1 KO control (red) versus GsMTx-4 (green) at −80 mV (downward) and +80 mV (upward) (*, P < 0.05, n = 5).

