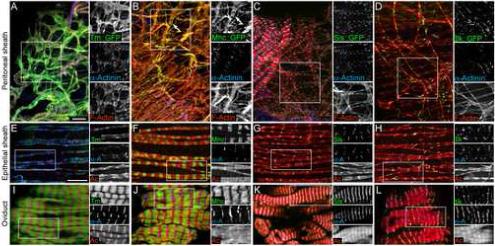
Figure 2.

Expression of GFP protein traps in known sarcomere proteins. (A-D) Peritoneal sheath labeled with antibodies to α-Actinin (blue) to view Z-discs and phalloidin (red) to reveal F-Actin. The peritoneal sheath is from flies expressing protein traps (green) in Tm1 (A), Mhc (B), Sls (C) and Ilk (D). (E-H) Epithelial sheath labeled as in A-D. (I-L) Oviduct labeled as in A-D. For all panels, the three individual color channels in the boxed regions are shown to the right. Scale bars: 10 μ.
