Figure 5.

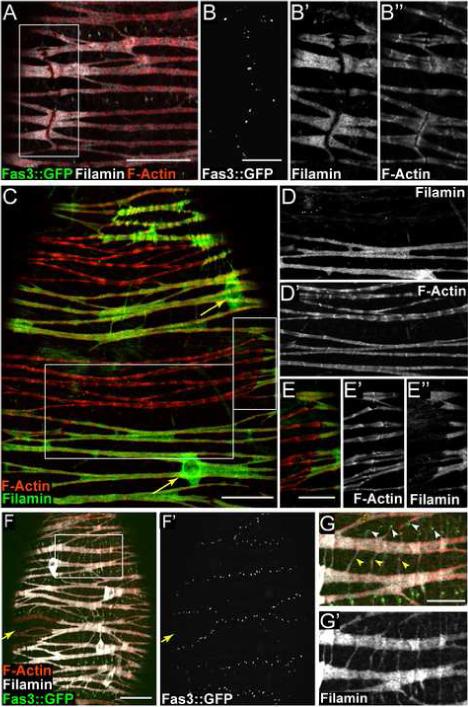
FLN12−20 and Fas3::GFP expression reveal epithelial sheath cell shape. (A) Immunofluorescence of epithelial sheath expressing Fas3::GFP (green) with FLN12−20 labeled white and phalloidin red. (B-B”) Higher magnification and channel separation of boxed area shown in (A). (C) Immunofluorescence of epithelial sheath showing mosaic expression levels of FLN12−20 (green). Phalloidin-labeled F-Actin is red. FLN12−20 is present in cell bodies around nuclei (arrows). (D-D”) Higher magnification and channel separation of boxed area in panel C. Sarcomeric F-Actin exhibits a more pronounced periodicity in cell expressing a lower level of FLN12−20 (compare sarcomeric bundles in the upper part of D’ with those in the lower half). (E-E”) Higher magnification and channel separation of boxed area in panel C. F-Actin “joints” coincide with borders between regions of high and low FLN12−20 expression. (F-F”) Epithelial sheath muscle expressing Fas3::GFP (green) and also displaying FLN12−20 (white) mosaicism. F-Actin is red. Region expressing low levels of FLN12−20 (arrow) is outlined by Fas3::GFP dots. (G-G’) Higher magnification and channel separation of boxed area shown in (F). Two types of fine projections are evident extending from muscle cell bodies: those associated with Fas3 dots (G, white arrowheads), and those that extend from one portion of a cell body to another (G, yellow arrowheads). Scale bars: A, C and F = 20 μ, B, E and G = 10 μ. Scale bar in C applies to D.
