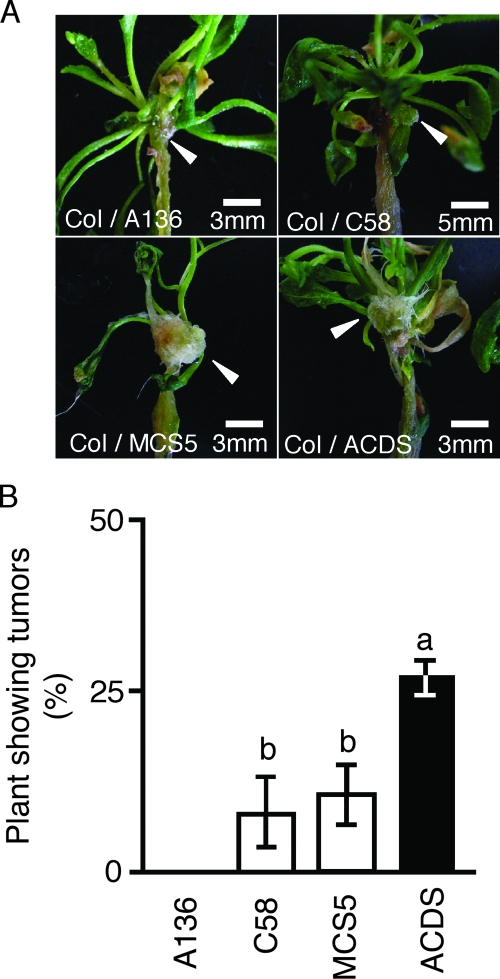
FIG. 3.
Estimation of the frequency of genetic transformation by acdS-expressing A. tumefaciens. (A) Photographs of tumor formation on A. thaliana Columbia (Col) stems. (B) Frequency of genetic transformation. A136, C58, MCS5, and ACDS indicate samples inoculated with A. tumefaciens strains A136, C58, C58(pBBRMCS-5), and C58(pBBRacdS), respectively. Bars indicate standard deviations (n = 3). The characters a and b represent statistically significant differences based on chi-square testing (P < 0.05).

