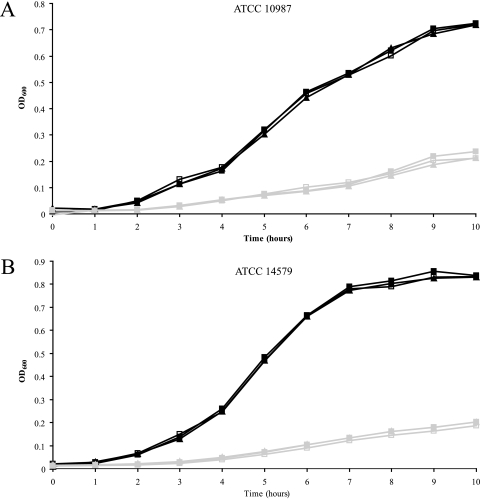
FIG. 1.
Impacts of urea and urease inhibitor on the growth (OD600) of B. cereus strains ATCC 10987 (A) and ATCC 14579 (B) in BHI at pH 7 (black lines) and pH 5 (gray lines). Cultures without supplements are depicted by open squares; the closed squares represent cultures with the addition of urea, and the closed triangles represent cultures supplemented with urea and flurofamide.

