FIG. 4.
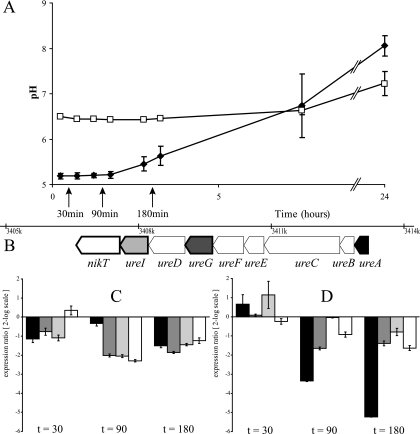
Impacts of pH and urease activity on the relative expression ratios of urease cluster genes of B. cereus ATCC 10987. (A) pH increase over time of ATCC 10987 cells in MES buffer with 10 mM urea at pH 5.2 (closed diamonds) and of cells in MOPS buffer with 10 mM urea at pH 6.5 (open squares). The error bars represent the standard deviations between duplicate experiments, and the time points at which RNA samples were taken are indicated by arrows. (B) Positions of the genes investigated with RT-RT-PCR within the urease cluster: ureA (black), ureG (dark gray), ureI (light gray), and nikT (white). The other genes (ureB, ureC, ureE, ureF, and ureD) are indicated in white, and the gene aliases are indicated at the bottom. (C and D) Relative expression ratios compared to time zero of ureA, ureG, ureI, and nikT (the colors correspond to those in panel B) of ATCC 10987 cells exposed to pH 6.5 in MOPS buffer with 10 mM urea (C) and to pH 5.2 in MES buffer with 10 mM urea (D) at 30, 90, and 180 min (left, middle, and right, respectively). The expression ratios are expressed in log2 scale, and the error bars represent the standard errors between the duplicate experiments.

