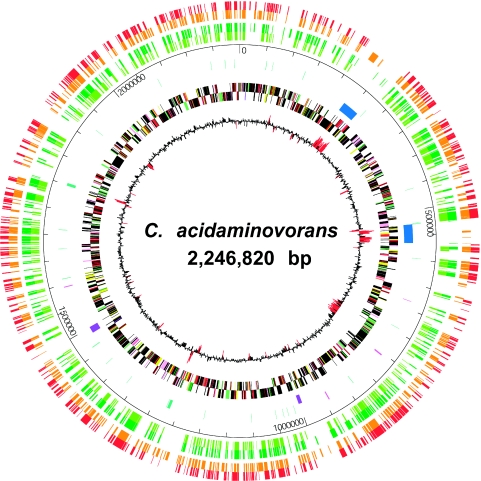
FIG. 2.
Circular representation of the “Candidatus Cloacamonas acidaminovorans” chromosome. The circles, from the inside out, show the following. (Circle 1) GC deviation (GCwindow − average GC of the genome, using a 1-kb window); regions with a GC deviation of less than twice the standard deviation are highlighted in red. (Circles 2 and 3) Predicted CDSs transcribed in clockwise/counterclockwise directions. Color coding for genes is as follows: amino acid biosynthesis, salmon; nucleotides/nucleosides, orange; central metabolism, brown; DNA metabolism, yellow; energy, green; fatty acid metabolism, purple; cell envelope, light green; protein synthesis/fate, pink; transcription, gray; transport, peach; regulatory functions, slate blue; extrachromosomal origin, violet-red; hypothetical and conserved hypothetical proteins, black. (Circle 4) CRISPR (violet-brown) and prophagic regions, (dark blue). (Circle 5) tRNAs (green), rRNA (violet-blue), insertion elements and transposases (pink). (Circle 6) Coordinates in Mb beginning at the dnaA gene. Circles 6 and 7 show the gene content comparison between the “Candidatus Cloacamonas acidaminovorans” and P. carbinolicus (light green), Synthrophus aciditrophicus (dark green), K. stuttgartiensis (orange), and T. tengcongensis (red) genomes using a similarity threshold of 30% identity and a ratio of 0.8 of the length of the smallest protein.

