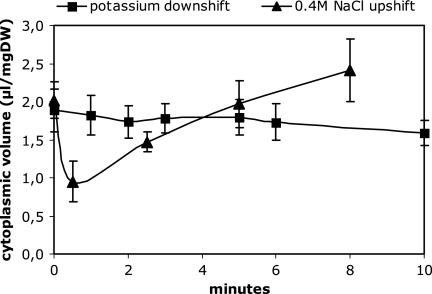
FIG. 2.
Cytoplasmic volume of E. coli M2701 after a potassium downshift or an osmotic upshift. Cells were grown to exponential phase in K20 minimal medium and then transferred to K0 minimal medium (squares) or to high osmolality by the addition of 0.4 M NaCl (triangles). At time points indicated, the cytoplasmic volume was determined as described in Materials and Methods. The data result from six (potassium downshift) or three (osmotic upshift) independent measurements. Values are given with standard deviations.

