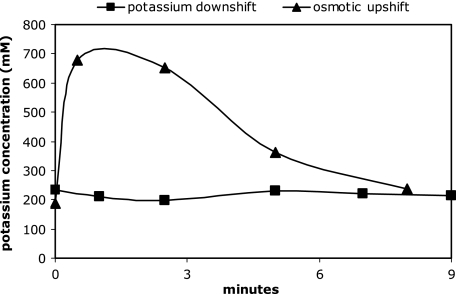
FIG. 5.
Cytoplasmic potassium concentration for E. coli M2701 after a potassium downshift or an osmotic upshift. Cells of E. coli M2701 were cultivated to exponential growth and then transferred to potassium-free medium (squares), or at time point zero, 0.4 M NaCl was added (triangles), as described in Materials and Methods. The cytoplasmic potassium content was measured by using flame photometry at time points indicated, and then the cytoplasmic potassium concentration was calculated based on the results of the cytoplasmic volume determinations. The potassium content was corrected for the amounts of potassium in the periplasmic and extracellular water space. Each data point represents values from three independent measurements.

