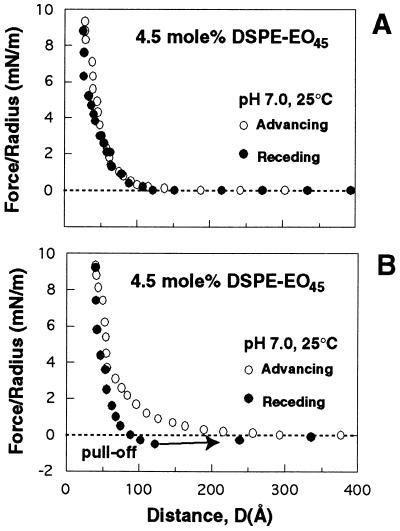
Figure 4.
Hysteresis measured at the onset of adhesion between streptavidin and PEG. (A) Before the onset of attractive streptavidin-PEG interactions, there was no difference between advancing (○) and receding (•) force profiles. (B) The onset of the attraction, as signaled by hysteresis in the receding force curve (•). The surfaces finally jumped apart at the position indicated by the arrow.

