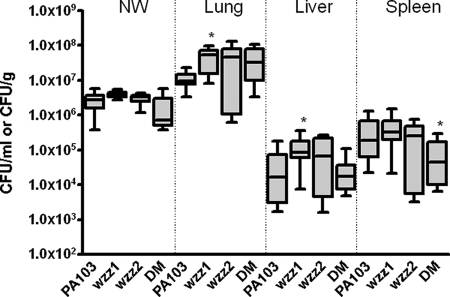
FIG. 5.
Dissemination of wzz mutants after intranasal infection of BALB/c mice. Dissemination of PA103 and the wzz mutants 24 h after infection is shown. Doses represented are as follows: PA103, 5 × 10⁵ to 8.1 × 10⁵ (n = 8); wzz1, 1 × 10⁶ to 1.5 × 10⁶ (n = 12); wzz 2, 7.7 × 10⁵ to 8.1 × 10⁵ (n = 7); double mutant (DM), 1.25 × 10⁶ to 1.5 × 10⁶ (n = 11). The number of mice for each group is indicated in parentheses. NW results are reported as CFU/ml, and organ burdens are given as CFU/gram. Data are plotted as a box-and-whiskers plot with the median and the lower and upper quartiles (25th and 75th percentile, respectively) represented by the box and the range represented by the whiskers. *, statistically significant compared to PA103 for the same sample (P < 0.05 using the Mann-Whitney U test).

