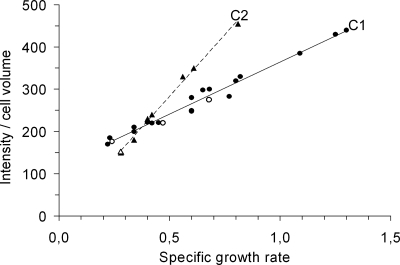
FIG. 3.
Cellular content of ribosomes (fluorescence signal intensity per cell volume) inferred by whole-cell hybridization with a fluorescence-labeled 16S rRNA probe of balanced cultures grown in defined media supporting different specific growth rates. The strains and culture conditions used are described in Materials and Methods. The solid line labeled C1 and the dashed line labeled C2 are regression lines. Bacterial isolates of the b genotype (triangles) display the C2 correlation between ribosome content and specific growth rate (r2 = 0.995). All other isolates tested (circles) display the C1 correlation (r2 = 0.978). Key data points are highlighted by open symbols: anaerobic growth of isolate p7 s1B1/05 of the b genotype is shown by the open triangle, and open circles show growth of the mucoid isolate p11 s3A1/05 of the 4 genotype in minimal medium supplemented with (from left to right) glucose or glucose with Casamino Acids or in LB medium (fastest growth). Each measurement is the average value obtained from the analysis of the fluorescence signal from more than 100 cells. The standard error of the mean was less than 15% for all measurements. Further details related to the data set (strain information, growth media, growth rate, and intensity per cell volume) are provided in the supplemental material.

