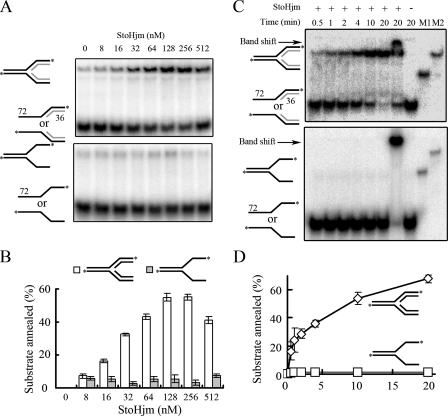
FIG. 5.
Structure-specific annealing activity of StoHjm. (A) Activity as a function of enzyme concentrations. Upper panel, single strands with partial complementary sequences that have the potential to form a Y-structure DNA (H1 and H2). Lower panel, 3′ and 5′ overhangs that have the potential to form a pseudo-replication fork containing nascent strands (S7 and S14). The reaction time was 30 min. (B) Quantification of the results in panel A. The percentage of annealed substrate was calculated as the ratio of the annealed product to the total labeled DNA. (C) Annealing activity as a function of reaction time. The concentration of StoHjm used was 100 nM. “M1” and “M2” indicate markers representing Y-shaped and fork DNAs, respectively. The arrows indicate gel shift DNAs. (D) Quantification of the results in panel B.

