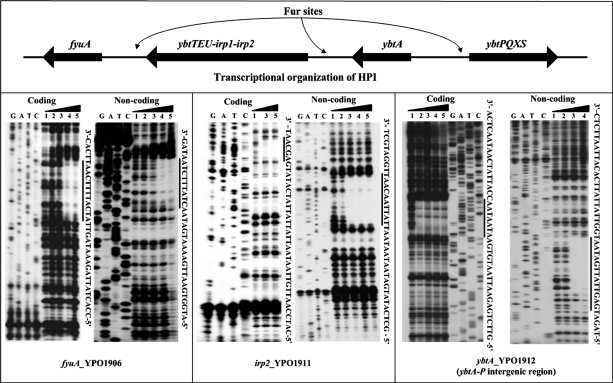
FIG. 4.
DNase I footprinting assays. Coding and noncoding strands containing the predicted Fur box region were labeled with [γ-32P] at the 5′ end, incubated with various amounts of purified His-Fur (lanes 1, 2, 3, 4, and 5 contained 0, 500, 1,000, 2,000, and 3,000 nM, respectively), and subjected to DNase I footprinting assays. Lanes G, A, T, and C represent the Sanger sequence reactions. On the right-hand side is indicated the protected region (bold line). The DNA sequences of footprints are shown from the bottom (5′) to the top (3′).

