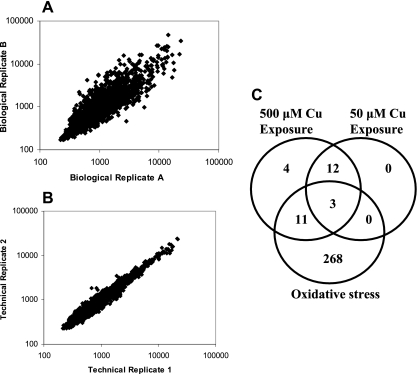
FIG. 4.
Microarray analysis of the Cu-responsive transcriptome in M. tuberculosis. (A) Reproducibility of technical replicates in NimbleGen-based arrays following hybridization with Cu-treated samples. The correlation (r > 0.95) between signals of two copies of the genome on a chip hybridized with a sample containing no Cu is shown. (B) Correlation (r > 0.67) of signals between biological replicates. The results for two biological replicates for samples containing no Cu are shown. (C) Venn diagram showing common and unique sets of Cu-responsive genes. The overlap with a previously identified oxidative stress data set (24) is shown for a comparison to genes induced with both low and high levels of Cu or with only high levels of Cu. As expected, most of the overlap occurs at the toxic concentration of Cu (500 μM).

