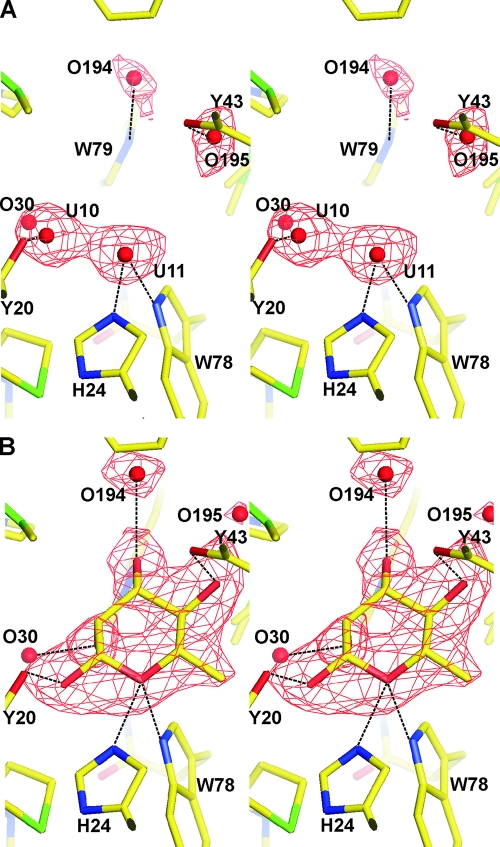
FIG. 6.
Stereoview omit Fobs-Fcalc electron density maps of the rhamnose binding site on RhaU. The maps were calculated with no water molecules or rhamnose in the binding site. (A) The omit map of the native protein prior to rhamnose binding. The red spheres indicate the water molecules that were ultimately refined into the model. (B) The omit map calculated after rhamnose binding. A model of rhamnose is superimposed on the map in the location where it was subsequently refined. In both panels, the Fobs-Fcalc density shown in red is modeled at a σ of 3.0.

